Prowebdesign was hired to:
- create better UX & UI with minimum or no change to underlying code
- make the app completely responsive and touch-adapted
- make it look pretty:).
Website UI elements
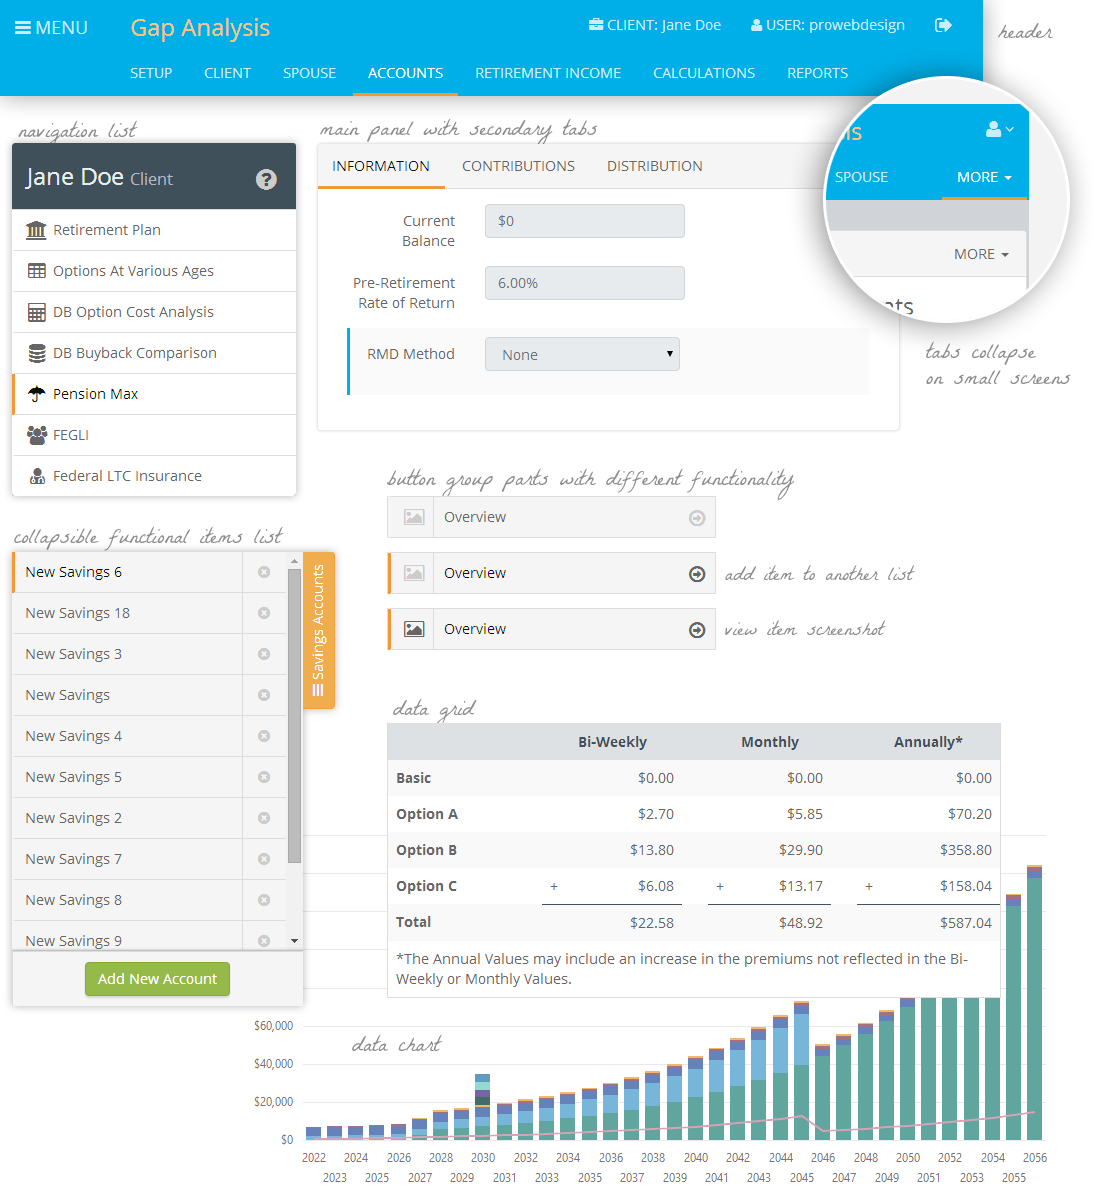
We’ve standardized and standardized some more. And achieved the level of standardization we are truly proud of:). The entire app interface came down to 4 reusable, multi-functional groups of elements:
- panels and cards that visually separate information
- navigation items lists – for navigation between the screens
- navigation tabs – for navigation between the screens. On small screens long row of tabs collapses under the MORE button with drop-down
- functional items lists. An item can actually be a group of sub-items, each having its own function – which saves a lot of space. Lists collapse on small screens
- data visualization aids – data grids (tables) and data charts – and forms were already in place
We approached ProWebDesign with a web app that had most of its structure in place but needed a bit of polish on the design side of things. They were happy to jump in mid-project and we soon were getting mockups that kept our basic structure but made it look much better. Irina was very responsive to email, open to feedback, and fun to work with. Our team looks forward to working with ProWebDesign on future projects.
Michael McFarland @ Trust Builders, Inc.
https://retireready.com
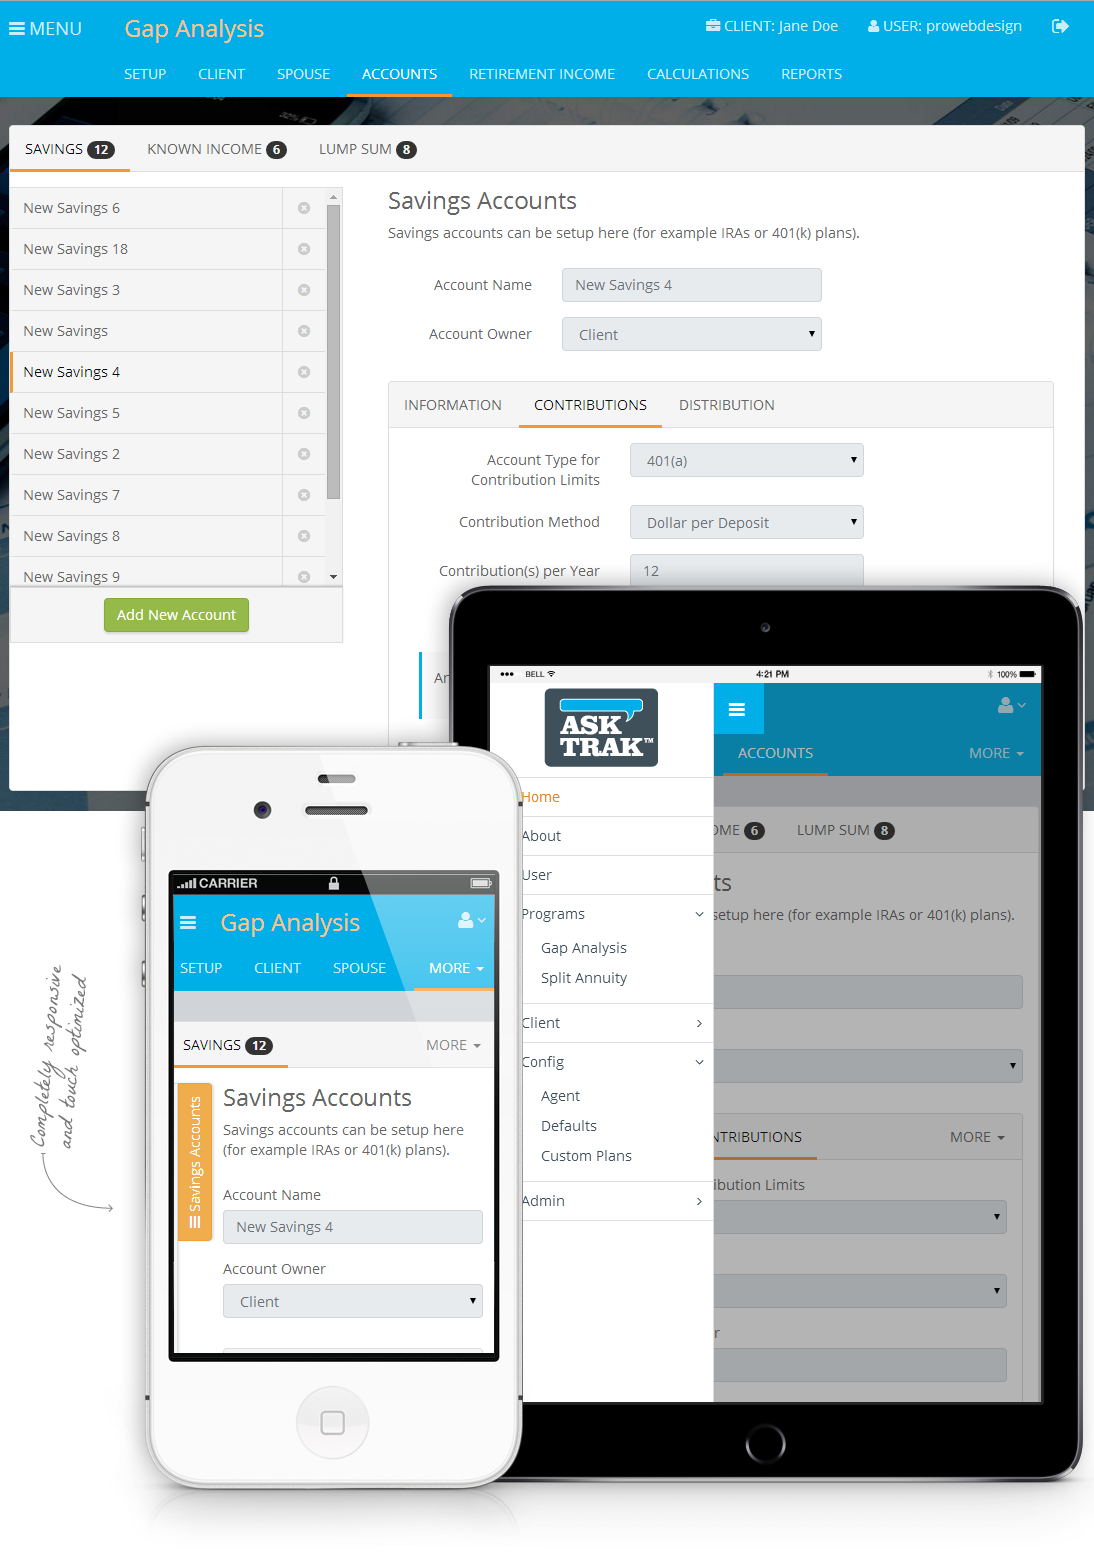
Completely responsive and touch optimized
The UX starts with inputting massive amounts of data. With app redesigned, the user can do it from virtually anywhere. Say, from a porch, using iPhone. The app doesn’t just “fit” well on a small screen. We took care that touch interactions are as smooth as possible: hover is replaced by clicks for ALL functional interactions, smooth overflow scrolling enabled, touch targets are properly sized, etc.
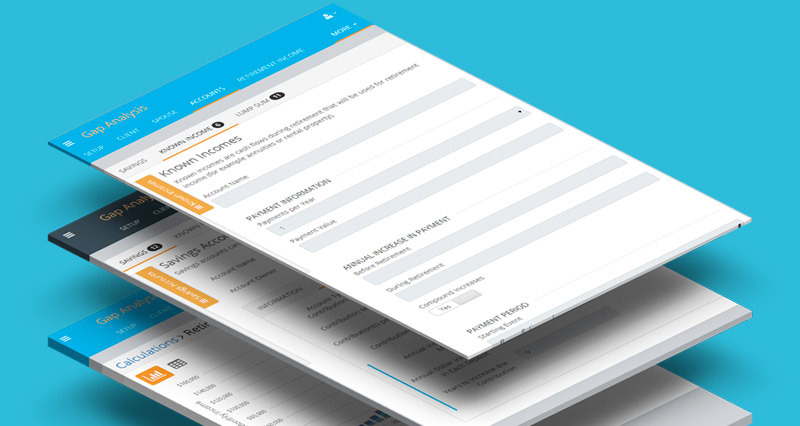
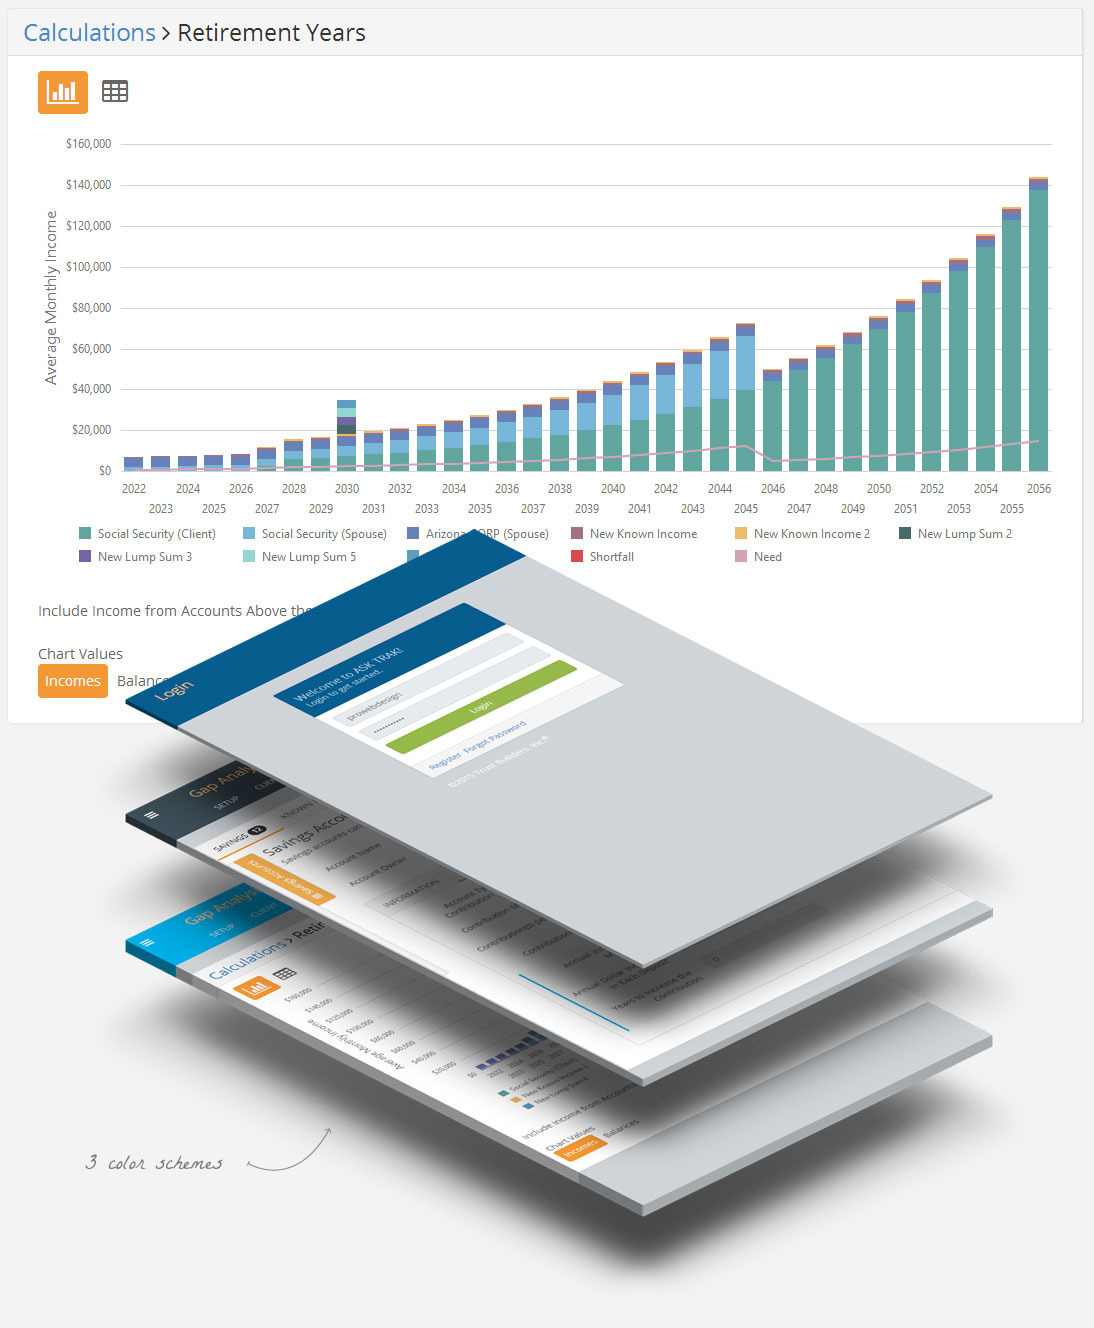
Data visualization
After all the data is inserted, it can be visualized in 2 forms: grid (table) or chart. When concentrating to look at large amounts of data, people can often be annoyed by what one would call “visual noise”: supporting elements of design. Colors, backgrounds, borders, etc. That’s why we have created 3 color schemes. Now users can choose one that is the most “invisible” and pleasant to them.
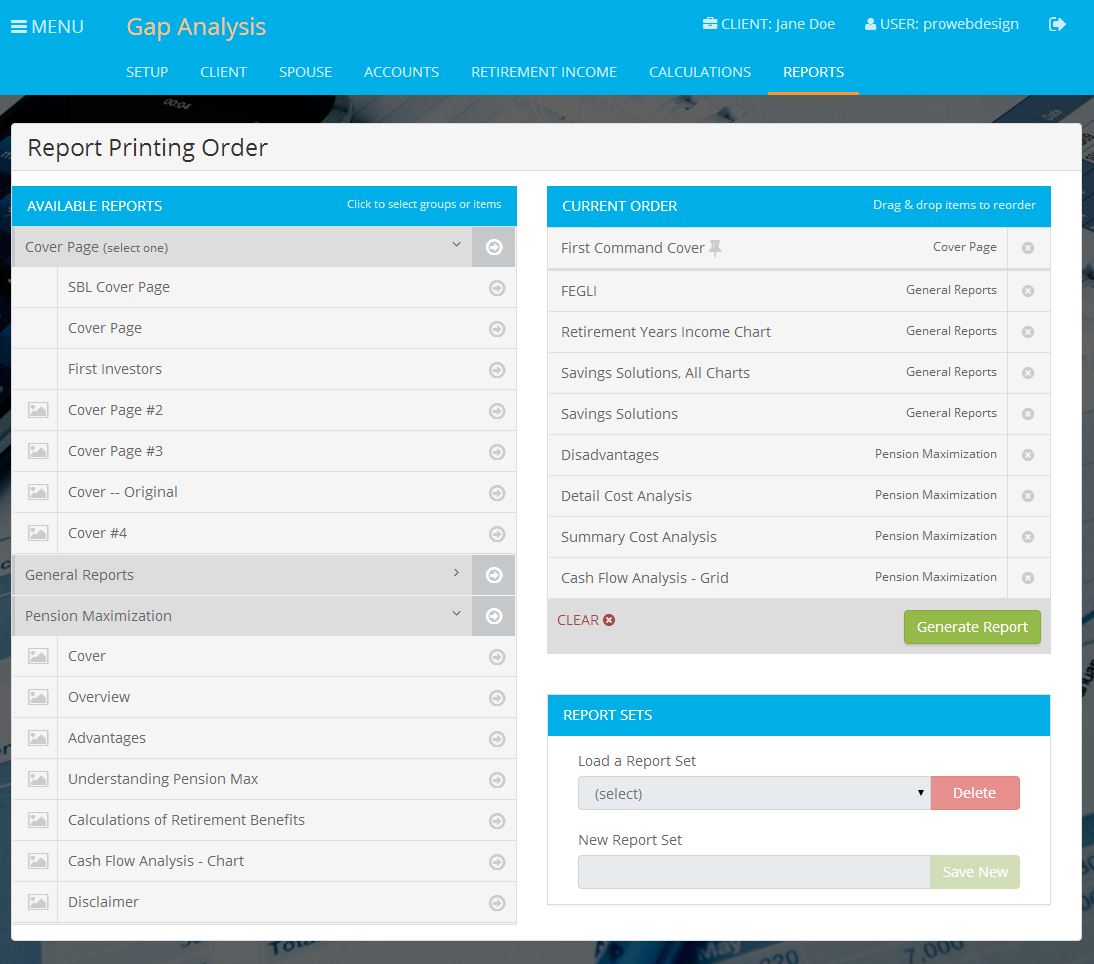
Data export
And finally, the data can be exported in form of printable reports. Reports generation screen was the messiest and the most challenging. Its elements can be added back-n-forth between the lists, rearranged by drag-n-drop, each element has a thumbnail that user can expand and view. Items in Current Order list can be saved/edited/deleted/re-exported as Report Sets. Etc. Still, the screen below doesn’t look scary at all:).